SYF
Synchrony Financial provides consumer financial services, specializing in promotional financing and credit cards.
Asset Summary
Loading summary…
Asset Performance Metrics and Risk Characteristics:
Metrics below use daily returns for Jan 1, 2026 – Oct 8, 2026 (YTD).
Understanding asset performance is crucial for evaluating investment quality and making informed decisions. Metrics like trailing return and drawdown provide insights into how an asset has performed over time, its volatility, and the efficiency of its returns relative to risk. Performance indicators help assess the stability, risk, and reward of an investment, allowing investors and portfolio managers to make comparisons and strategize accordingly.
1 Month Trailing Return
-8.51%
Represents the percentage change in asset value over the past month.
3 Month Trailing Return
5.38%
Indicates the percentage change in asset value over the last three months.
Period Max Drawdown
27.91%
The highest percentage drop from the peak value to the lowest point during the observed period.
Standard Deviation
32.98%
Shows how much the asset’s daily returns deviate from the average, annualized for the entire period.
Sharpe Ratio
-0.48
Measures the average return earned in excess of the risk-free rate per unit of volatility, annualized.
Calmar Ratio
-0.57
The ratio of the annualized return to the maximum drawdown, reflecting the return per unit of risk.
Asset Technical Analysis
Technical analysis involves evaluating an asset's price and volume data to forecast future movements and make informed trading decisions. Using indicators such as moving averages, pivot levels, momentum studies, and candlestick pattern scans can clarify trend strength and volatility. The tabs below summarize moving averages, pivots, technical indicators, candlestick patterns, and recent prices for this symbol.
Analysis
Moving Averages
Moving Averages are commonly used to smooth out price data and identify trends over a specific period. Here’s a summary of the latest moving averages for various periods:
| Type/Period | |
|---|---|
| SMA | |
| EMA | |
| WMA | |
| WEMA |

- SMA (Simple Moving Average): Reflects the average price over a specific number of periods.
- EMA (Exponential Moving Average): Gives more weight to recent prices, making it more responsive to new information.
- WMA (Weighted Moving Average): Assigns a weight to each price, emphasizing more recent prices.
- WEMA (Weighted Exponential Moving Average): Combines elements of both WMA and EMA for a more responsive moving average.
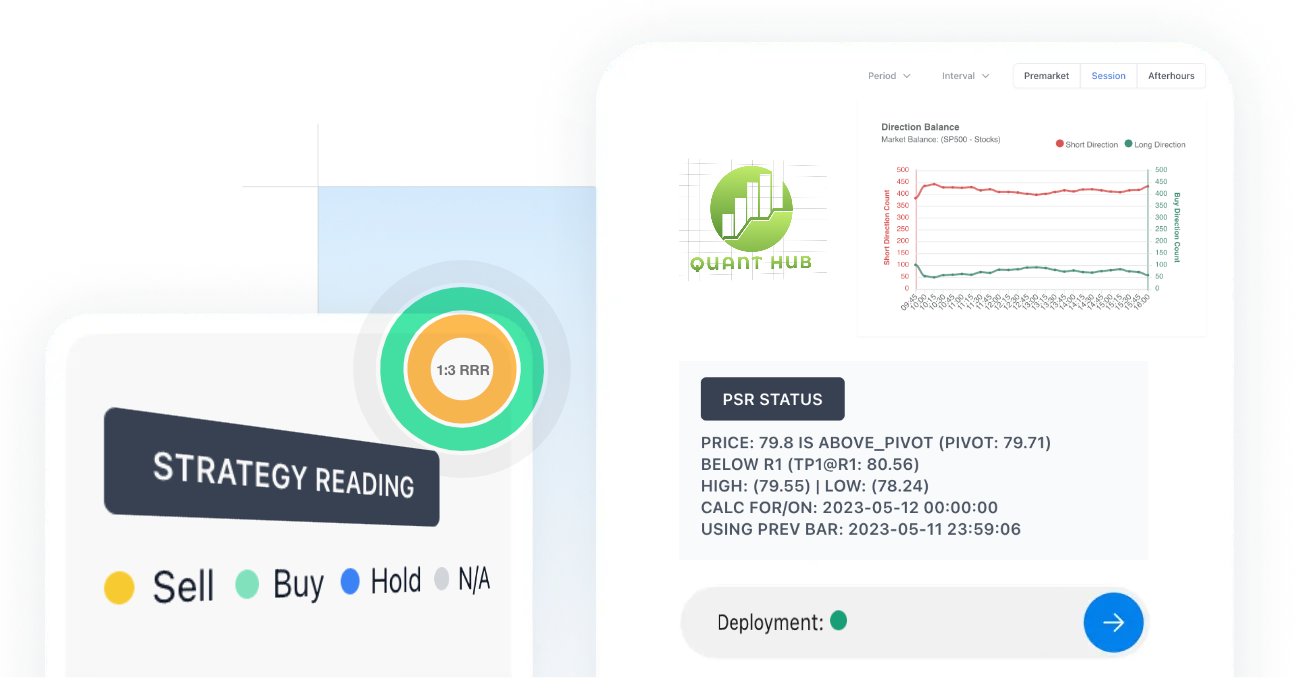
Enhance Your SYF Trading Now
Empower your trading with OHLCX Platform. Our comprehensive platform delivers precise analysis and strategic insights for SYF, designed to improve your trading outcomes. Elevate your trading approach instantly and unlock new opportunities with our advanced system!
Start Optimizing NowFrequently Asked Questions
-
Synchrony Financial was founded in 2003 and has since grown into one of the largest providers of private label credit cards.
-
Synchrony benefits from strong partnerships, a diverse product portfolio, and a focus on customer service excellence.
-
Synchrony serves consumers and retail partners, providing financing solutions across multiple sectors.
-
Synchrony prioritizes data security through advanced technology and compliance with regulatory standards to protect consumer information.
-
Synchrony is committed to fostering a diverse workforce and creating an inclusive environment through various initiatives.
-
Synchrony’s strategy includes strategic partnerships, digital transformation, and broadening its product offerings to attract more customers.
-
Synchrony provides marketing support, training, and technology solutions to help retail partners grow their business.
-
Synchrony offers credit card services, financing options, and loyalty programs for various retailers and businesses.
-
Synchrony focuses on technological advancements to enhance customer experience and streamline the application process.
-
Yes, Synchrony Financial is publicly traded on the New York Stock Exchange under the ticker symbol SYF.
Top Market Assets
Discover our curated selection of top-performing exchange-traded funds (ETFs) that represent a diverse range of investment opportunities.
SPY is an exchange-traded fund (ETF) that aims to replicate the performance of the S&P 500 Index. The S&P 500 Index includes 500 of the largest publicly traded companies in the United States, representing a broad cross-section of the U.S. economy.
QQQ is an exchange-traded fund (ETF) that tracks the performance of the Nasdaq-100 Index. This index includes 100 of the largest non-financial companies listed on the Nasdaq Stock Market, primarily focusing on technology and innovation sectors.
DIA is an exchange-traded fund (ETF) that aims to track the performance of the Dow Jones Industrial Average (DJIA). The DJIA is a stock market index consisting of 30 large, publicly traded companies in the United States, representing a broad range of industries.
IWM is an exchange-traded fund (ETF) that seeks to track the performance of the Russell 2000 Index. The Russell 2000 Index measures the performance of the 2,000 smallest stocks in the Russell 3000 Index, representing a broad segment of small-cap U.S. companies.
Disclaimers
The information displayed on this site is sourced from third-party providers and is believed to be reliable. OHLCX has not independently verified this data and does not guarantee its accuracy. Content is for educational and informational purposes only and is not financial or investment advice.
With any investment, your capital is at risk. Past performance is no guarantee of future results. Consult your provider's terms and privacy policies where applicable.
Market data is provided in near real-time when available, but we do not guarantee its accuracy or timeliness.
Securities products are: Not FDIC insured · Not bank guaranteed · May lose value
Trademarks and logos are the property of their respective owners and do not represent endorsements of any kind.